
Generate Reports
Data-driven decisions start with clear reports. Learn how to generate project and team reports, filter by date ranges and categories, and export insights to share with stakeholders — helping you spot trends and keep performance on track.
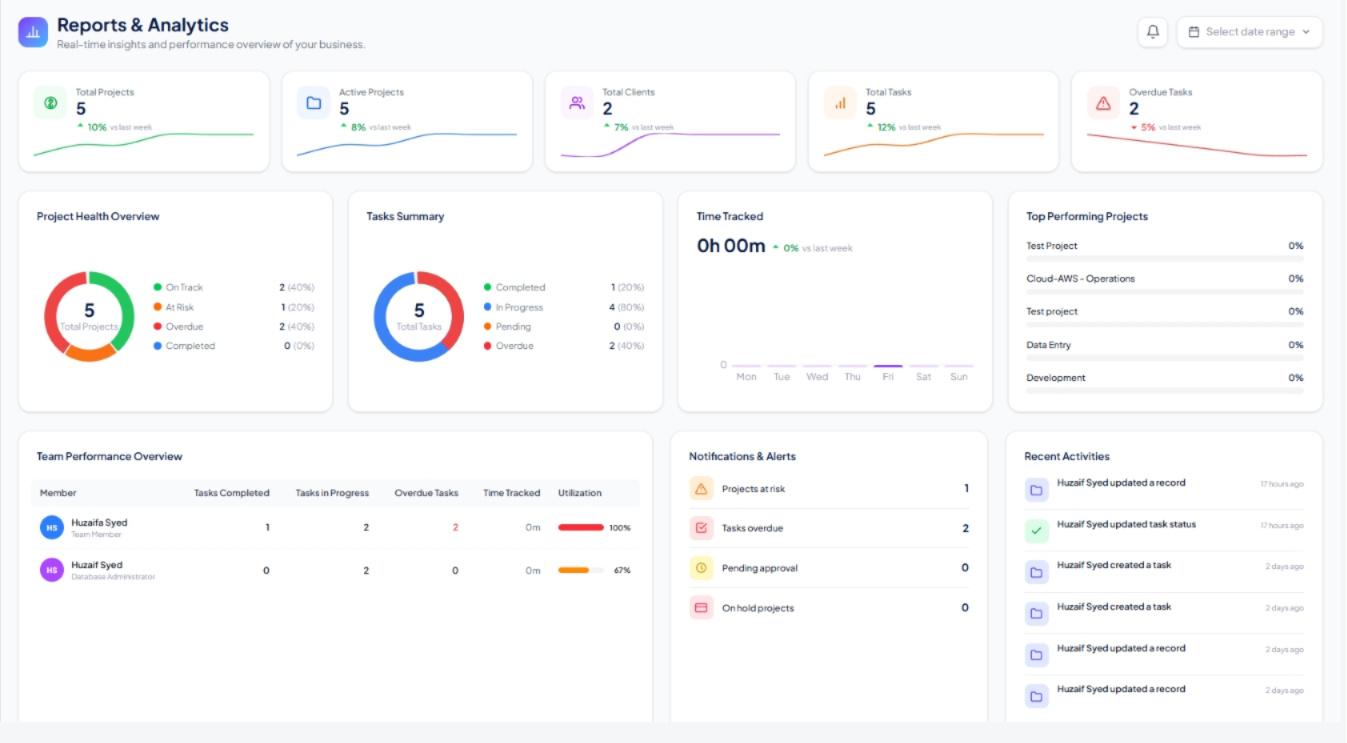
Step 1: Navigate to Reports
Click "Reports" in the left sidebar to open the Reports home page. You will see a selection of pre-built report types arranged by category: Project, Team, and Tasks.
Step 2: Choose a Report Type
Select "Project Summary" for a high-level view of all projects and their health scores, or "Team Workload" to see how tasks are distributed across your team members. Each report card includes a short description of its intended use.
Step 3: Set Filters and Date Range
Use the filter bar at the top of the selected report to narrow results by project, team member, task status, or date range. Combining a date range with a specific project is the most effective way to review sprint-level progress.
Step 4: Read and Interpret Your Report
Reports render as interactive charts paired with sortable data tables. Hover over chart segments to see exact values. Click any column header in the table to re-sort the data, making it easy to surface top performers or at-risk items.
Step 5: Export and Share
Click "Export" to download the current report view as a CSV or PDF. The CSV is ideal for importing into spreadsheet tools; the PDF is formatted for presentations or stakeholder emails. Use "Copy Link" to share a live version that auto-updates as your data changes.